GNN Structure (Species-Size) Maps
Note: There is an updated GNN structure map using
imagery from 2017. Please visit the our
new download site
to download these data. We recommend that users download this new version
rather than the GNN structure map available below.
|
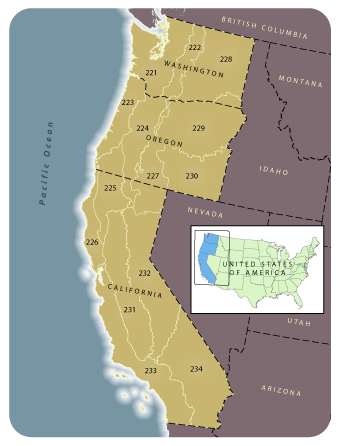
OverviewThis page provides links for downloading master mosaics that cover the entire geographic area for which the most current GNN 'structure' maps are available. The grids are created by mosaicking together the GNN output for all of the modeling regions (see map) for a given imagery year. Since the modeling region boundaries are non-overlapping, the mosaics contain exactly the same results as the individual modeling region grids. Each mosaic is based on the same imagery date and plot datasets, so the mosaics are internally consistent across modeling regions. |
Map Products
Digital GNN imputation maps are provided as 30-m-resolution ArcGIS grids, where the grid value is a unique plot number that links to the plot database. Selected vegetation variables from the plot database are joined as items in the grid to facilitate viewing and exploratory spatial analysis. Metadata for the vegetation variables are included with the grids and in the plot database. Dates for maps developed from GNN species-size models are determined by the vintage of the satellite imagery used in their development.
The GNN models apply only to forest land (areas currently or with the potential to support at least 10% tree cover), because a consistent regional plot sample of nonforest areas is unavailable. Most users will want to use "masked" versions of the GNN maps (provided below), where areas of nonforest land cover developed from the GAP Analysis Program's Ecological Systems map have been embedded in the GNN grids. Unmasked versions of the GNN maps are available upon request, for users who would like to apply a nonforest mask of their own choosing.
The accuracy assessment reports included in the download file are compiled at the modeling region level and provide accuracy assessment information for plots within each modeling region.
| Product Description | Status | Imagery year | Date posted | Download |
| GNN species-size map and accuracy assessment report | FINAL | 2012 | 08/28/2014 |
Data Dictionary
The data dictionary below lists all fields that have been attached to the above map products. If a field has coded entries, clicking on the plus symbol in the first column ('C') will show all codes. For information on how a field is calculated, click on the plus symbol in the second column ('F') for details. The dictionary can be fully expanded or collapsed with the below links.