
LiGNN - LiDAR integration with GNN
Project summary
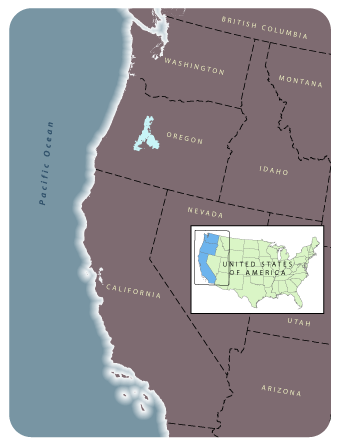
For this project we developed detailed maps of existing forest vegetation in 2010 for the area covered by the Deschutes National Forest in Oregon. We used Gradient Nearest Neighbor (GNN) imputation (Ohmann and Gregory 2002) to map detailed vegetation composition and structure for areas of forest and woodland. This study investigated how lidar-derived vegetation indices, disturbance history from Landsat time-series imagery, plot location accuracy, and plot size influenced accuracy of GNN maps. The primary research question was whether including lidar-derived vegetation structure metrics and Landsat-derived disturbance metrics as spatial predictors improve GNN map accuracy. Secondary objectives were to determine if improved GPS locations of inventory plots and plot size (plots versus subplot) influence GNN map accuracy. See Zald et al. (2014) for more detail about this project.
This study emphasizes that GNN is a method, not a specific map product, that can be applied to a wide variety of spatial and non-spatial datasets. The analyses utilized lidar data collected in 2009 and 2010, spectral data and disturbance metrics derived from Landsat yearly time-series data from 1984-2012, and field plot data from regional forest inventories (FIA and CVS). The study demonstrates how incorporating fine-scale data from lidar into GNN modeling can result in substantial improvements to map accuracy for measures of forest structure (but not necessarily for species composition) over maps based on Landsat alone.
The GNN map products can be used in assessing forest vegetation structure within the context of late-successional and old-growth forest conservation, wildfire risk assessment, and fuel reduction treatment planning on the Deschutes National Forest.
Collaborators and Support
This research was supported by the Western Wildland Environmental Threat Assessment Center, USDA Forest Service. Plot data and GPS coordinates were provided by the Forest Inventory and Analysis Program, Pacific Northwest Research Station, USDA Forest Service, and personnel of the Deschutes National Forest. Bob McGaughey (USFS) created gridded lidar-derived vegetation structure metrics and Justin Braaten (OSU) processed the Landsat variables used in this study.
GNN models and map products for LiGNN Project
The use of multivariate statistics and imputation by GNN results in unique spatial modeling properties. Alternative model forms can be specified to optimize for different objectives and outcomes. See our methods pages for more detail on GNN.
For the LiGNN project, we are providing separate GNN species composition and forest structure models and associated map products. The GNN models for this project used only FIA and CVS inventory plots. For the species model, response variables in model development were percent cover by tree species. Response variables for the GNN structure model were basal area of all live trees, quadratic mean diameter of dominant and codominant trees, height to crown base of live trees, and tree density by size class. Explanatory variables were derived from light detection and ranging (lidar), Landsat satellite imagery, Landsat-derived disturbance history, and mapped environmental data. All maps were developed for the Deschutes National Forest for 2010, at 30-m resolution.
Whereas this project examined effects of several combinations of explanatory variables, plot location accuracy, and plot size, we are providing only the "best" GNN maps for download. These GNN maps were created using lidar-derived vegetation structure metrics, Landsat imagery, Landsat-derived disturbance history metrics, improved GPS plot locations, and whole inventory plots.
The GNN maps are mosaics that cover the entire LiGNN project area (Deschutes National Forest). Small inholdings of non-federal forest ownership were not mapped, because ownership type can strongly influence forest management history and therefore forest composition and structure (Ohmann et al., 2007), and available plot data were insufficient to characterize non-federal forest conditions within the boundaries of the study area.
Accuracy assessments for predictions of species composition and vegetation structure can be found in figures 3-5 of Zald et al. 2014.
| Product Description | Status | Imagery year | Date posted | Download |
|---|---|---|---|---|
| GNN structure map | FINAL | 2010 | 05/05/2014 | |
| GNN species map | FINAL | 2010 | 05/05/2014 |
Data Dictionary
The data dictionary below lists all fields that have been attached to the above map products. If a field has coded entries, clicking on the plus symbol in the first column ('C') will show all codes. For information on how a field is calculated, click on the plus symbol in the second column ('F') for details. The dictionary can be fully expanded or collapsed with the below links.
No data dictionary is currently available.
Plot Databases for LiGNN
LEMMA offers a number of ancillary data tables associated with the maps for this project. Because the LiGNN project area is a geographic subset of our larger mapping area, the plot database provides all stand-level data that we have for the LiGNN project. However, there are many plots in this database that were not used for LiGNN, so users will have many more records than they will need for the LiGNN project. If you need tree-level data or a plot database that is subsetted down to just the plots used in the LiGNN study, please contact us.
Publications, Reports, and Presentations
Loading publications ...