GNN Mapping for Northwest Forest Plan Effectiveness Monitoring
Project summary
The gradient nearest neighbor (GNN) map products developed for this project are used to assess changes in late-successional and old-growth forest, and habitat for the northern spotted owl, marbled murrelet, and aquatic species, as part of Effectiveness Monitoring for the Northwest Forest Plan (NWFP). The primary research component of this project focused on techniques for developing temporally consistent maps with nearest neighbors methods using Landsat time-series data (Ohmann et al. 2012; Ohmann et al. in press). Two versions of GNN maps have been developed for NWFP monitoring: the first set for the 15-year report (Moeur et al. 2011) and the current version for the 20-year report (Davis et al., in review).
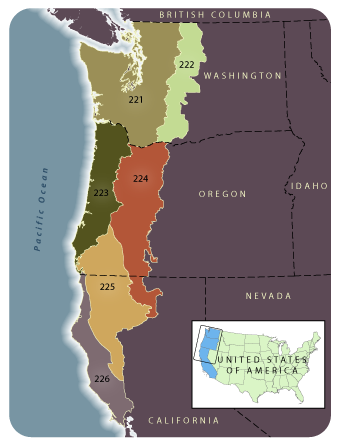
We developed GNN maps of forest vegetation and land cover for modeling regions covering the NWFP area in Washington, Oregon, and California. GNN imputation (Ohmann and Gregory 2002), described in detail on our methods page, is used to map detailed vegetation composition and structure for areas of forest and woodland. GNN uses multivariate gradient modeling to integrate data from field plots with satellite imagery and mapped environmental data. The mapping incorporates data from ongoing forest inventories conducted by the Forest Inventory and Analysis (FIA) Program, Pacific Northwest Research Station (PNW), USDA Forest Service, Current Vegetation Survey (Region 6, USDA FS, and BLM in western Oregon), and Region 5 (USDA FS). A suite of fine-scale plot variables is imputed to each pixel in the GNN digital map, and regional maps can be constructed for any of the vegetation attributes available for the plots. Areas of nonforest are masked out using ancillary data. All GNN map products for the NWFP are grid-based at 30-m spatial resolution.
For the NWFP, GNN maps were developed using Landsat satellite imagery that was 'temporally normalized' using the LandTrendr algorithms (Kennedy et al. 2010) to produce a yearly time-series of imagery mosaics from 1984 to 2012. GNN maps for the 15-year report were developed using two imagery dates, and were constructed for two dates: 1996 and 2006 in Oregon and Washington, and 1994 and 2007 in California. For the 20-year report, many improvements to data and methods were incorporated (Davis et al., in review; Ohmann et al., in press). A yearly time-series of Landsat imagery mosaics from 1984 to 2012 was used in GNN model development, and GNN maps were developed for 1993 and 2012 for all states.
GNN Map Products for NWFP Effectiveness Monitoring, 20-year Report
For the NWFP mapping, we are providing GNN species-size models and associated map products. To download GNN map products, visit the data download page. The most current versions of the GNN maps are provided, and these maps replace all previous versions of GNN species-size maps.
Collaborators and Support
Research collaborators included Robert Kennedy, Boston University; the Forest Inventory and Analysis (FIA) Program, Pacific Northwest Research Station (PNW), USDA Forest Service; the Laboratory for Applications of Remote Sensing in Ecology (LARSE) (Justin Braaten, Warren Cohen, and Zhiqiang Yang); Andrew Gray (PNW FIA); Ray Davis and Melinda Moeur (Region 6, USDA FS); and Maria Fiorella (BLM). Funding was contributed by Region 6, USDA FS; the Resource Monitoring and Assessment Program, PNW, USDA FS; Oregon Department of Forestry; and Washington Department of Natural Resources.
Publications, Reports, and Presentations
Loading publications ...