GNN Methods
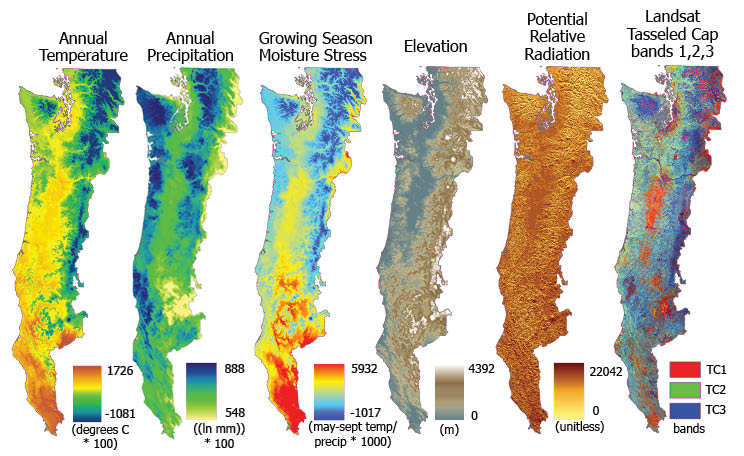
GNN is an imputation modeling technique that produces maps where each pixel is associated with the inventory plot that has the most similar spectral and environmental characteristics. In preparation for model development, we maintain a large regional plot inventory database and many spatial (explanatory) variables. See examples of explanatory variables
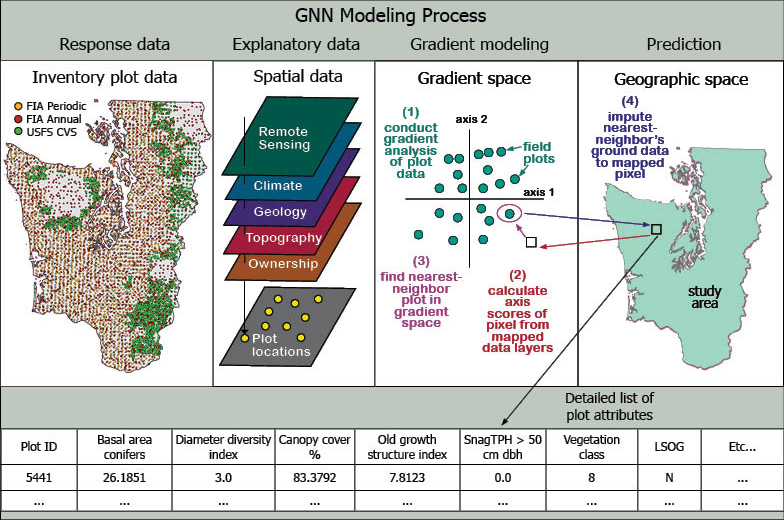
We create GNN models by following these steps. Note that steps 1-4 correspond to the numbers on the diagram below.
- Using direct gradient analysis (stepwise canonical correspondence analysis, CCA), quantify relations between ground (response) data and mapped (explanatory) data.
- For each pixel, calculate scores on the first eight CCA axes from the mapped explanatory variables.
- For each pixel, identify the single plot that is nearest in eight-dimensional gradient space. Distances are Euclidean, with axis scores weighted by their eigenvalues.
- Impute the ground attributes of the nearest-neighbor plot to the mapped pixel.
- Mask out nonforest areas using best available ancillary data. In the Pacific coast states, we are using maps of Ecological Systems developed for the Gap Analysis Program.
For more details about GNN methodology, see Ohmann and Gregory 2002
Examples of Explanatory Variables