GNN Maps and Data
Note: There are updated GNN structure maps using
imagery from 2017 and 2021. Please visit the our
new download site
to download these data. We recommend that users download these newer versions
rather than the GNN structure map available below.
Available GNN maps
We are currently serving both GNN structure and species maps for large areas of the Pacific Coast States. Please see our model types page to determine which map would be best suited for your purposes. The maps below show the current extent of each dataset. Please click the map to be directed to the data download page.
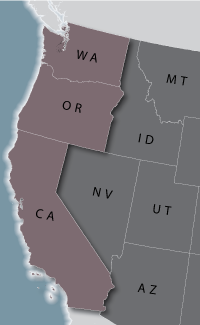
GNN Structure maps
This page provides links for downloading master mosaics that cover the entire geographic area for which the most current GNN 'structure' maps are available. The grids are created by mosaicking together the GNN output for all of the modeling regions (see map) for a given imagery year. Since the modeling region boundaries are non-overlapping, the mosaics contain exactly the same results as the individual modeling region grids. Each mosaic is based on the same imagery date and plot datasets, so the mosaics are internally consistent across modeling regions.
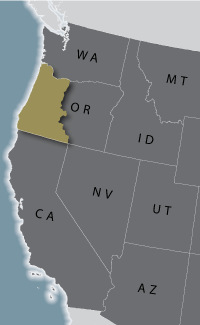
GNN Species maps
This page provides links for downloading GNN species maps. For modeling region 118 (see map), a single GNN model was developed for the entire area (see Ohmann et al. 2011). Response variables used in model development were cover by species for woody species (all tree species, and shrub species present on at least 20 plots). This species model excludes satellite imagery, disturbance, and land ownership variables as explanatory variables, as they are more strongly correlated with forest structure than with species composition.